“How long will my car take to charge?” has a clean answer once you have four numbers. Battery capacity, charging power, where you start, where you want to end. This guide walks through each input, shows the one formula underneath it, and explains the one thing most napkin math gets wrong: the taper. To skip straight to the answer for your own car, try the interactive charging time calculator and read on to understand what it is doing.
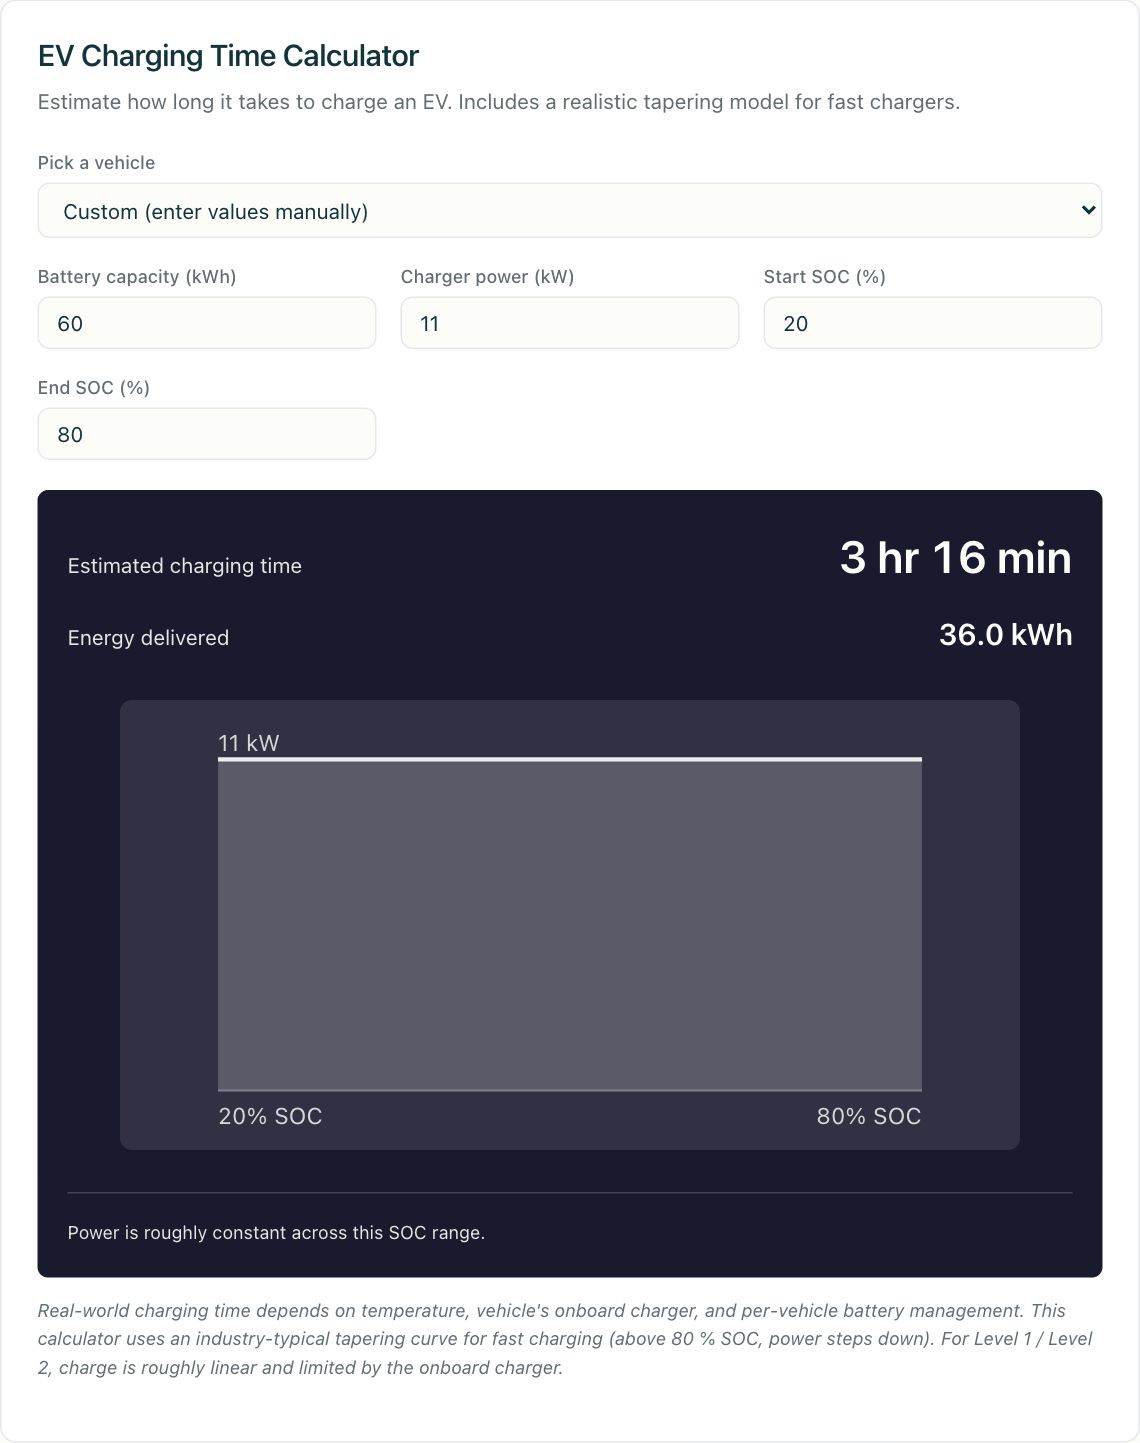
The goal here is not just a number. It is to make the number trustworthy — so that when the calculator says “27 minutes,” you know why, and you know when reality will run longer.
The four inputs, and why each one matters
Every honest charging-time estimate comes from the same four fields the calculator asks for.
- Battery capacity (kWh). Your pack’s usable size. Check the spec sheet; most current EVs land between 40 and 100 kWh. This sets the total energy the car can hold.
- Charger power (kW). The rate energy flows in. This is where most estimates go wrong — see the next section on which kW to enter.
- Start SOC (%). Your current state of charge. You almost never start empty.
- End SOC (%). Your target. For public charging this is usually 80%, not 100%, and there is a good reason for that.
The reason SOC matters so much is that you are rarely moving the whole battery. A 20% → 80% session on a 75 kWh pack moves 60% of it — 45 kWh — not 75. Enter the real window and the estimate snaps into focus. Enter 0 → 100 out of habit and you will overestimate a normal top-up by a wide margin. If the split between “how big” (kWh) and “how fast” (kW) feels blurry, kW vs kWh explained draws the line cleanly.
The formula underneath the tool
Strip away the interface and every charging calculator is doing one division:
Time = Energy needed ÷ Effective power
Where energy needed = battery capacity × (end SOC − start SOC), and effective power is the real rate flowing — not the number printed on the station.
Worked example: a 75 kWh EV going 20% → 80% needs 75 × 0.60 = 45 kWh. On a 7.2 kW Level 2 charger, 45 ÷ 7.2 ≈ 6.25 hours. On a 150 kW DC charger the raw math says 45 ÷ 150 = 18 minutes — but that number is a lie, because DC power does not stay flat. Hold that thought for the taper section.
The calculator runs this division for you and, for DC sessions, corrects for the taper automatically. But knowing the formula means you can sanity-check any result and spot when an input is off.
Which kW to enter: the constraint that binds
The most common mistake is typing the station’s advertised power. The real rate is the lowest of three limits:
- The station’s maximum output
- Your vehicle’s maximum acceptance (onboard AC charger for Level 1/2, peak DC rate for fast charging)
- What the battery will accept right now, given its SOC and temperature
For AC charging, the binding constraint is almost always your car. Plug a vehicle with a 7.2 kW onboard charger into an 11 kW Level 2 station and it draws 7.2 kW — the extra station capacity sits idle. So enter 7.2, not 11. Onboard AC chargers commonly range from 3.3–6.6 kW on older or base trims, 7.2–11.5 kW on most current EVs, up to 19.2 kW on some premium models.
For DC fast charging the binding constraint is usually your car’s peak DC acceptance — 50 kW on early EVs, 100–150 kW on mid-range models, 200–250 kW on newer platforms, and 300 kW-plus on premium ones. A 350 kW station does nothing for a car capped at 150 kW. The tiers and where the AC-to-DC ceiling comes from are laid out in Level 1 vs Level 2 vs DC fast charging.
Rule of thumb for the calculator: enter the smaller of station and vehicle. That single habit fixes most unrealistic estimates.
The taper curve: the thing flat math ignores
Here is what separates a real calculator from back-of-envelope division. DC fast charging does not deliver its peak rate the whole way. Above roughly 80% SOC — and often easing earlier — the battery management system deliberately cuts the acceptance rate to protect the cells from the heat and stress of high-current charging near full.
The shape looks roughly like this:
- 0–50% SOC: at or near peak rate
- 50–80% SOC: beginning to ease down
- 80–95% SOC: heavily tapered, frequently around half of peak
- 95–100% SOC: a trickle, often a third of peak or less
The practical consequence is blunt: on a DC fast charger, going 80% → 100% often takes as long as 20% → 80%. That is why the calculator’s answer for an 80% target is short and its answer for a 100% target balloons — and why seasoned drivers set the end SOC to 80 and drive on. This is the single most important reason to stop treating charge time as a straight line.
A quick illustration. Take a 77 kWh EV with a 230 kW peak, plugged into a 150 kW station, going 20% → 90%:
- 20% → 80% moves ~46 kWh at the flat 150 kW ceiling — roughly 18 minutes.
- 80% → 90% moves only ~7.7 kWh, but at a tapered average nearer 75 kW — roughly 6 minutes.
That last 10 percentage points takes a third of the total time while adding a seventh of the energy. A calculator that ignores taper would tell you the whole thing takes about 21 minutes flat; the taper-aware answer is closer to 24, and it climbs fast if you push toward 100%. For the full mechanism behind the curve, see how long it takes to charge an EV (coming soon).
What the calculator can’t see (and how to adjust)
A calculator works from clean inputs. Reality adds friction the four fields don’t capture:
- Cold weather. A cold battery accepts current slowly. Below freezing, DC rates can run 20–50% slower until the pack warms, so pad a winter estimate accordingly. AC charging is barely affected.
- Shared-power stations. Some DC sites split a cabinet’s output between two bays. The advertised kW may not be what lands when the neighboring stall is busy.
- Session ramp-up. The first minute or two of a DC session ramps toward peak rather than hitting it instantly. Trivial on a long charge, noticeable on a short one.
- The 100% habit. If you enter 100% as your end SOC out of reflex, expect a long tail. On DC, target 80%. At home overnight, full is fine because time is not the constraint.
None of these break the formula — they widen it. Treat the calculator’s number as a floor for a warm battery on a healthy station, and add margin for cold and congestion.
From time to range: the number you actually feel
Charge time answers “how long.” Most people really want “how far.” Bridge the two with efficiency: energy added × miles per kWh. Thirty minutes at a real-world 100 kW adds ~50 kWh; at 3.5 mi/kWh that’s about 175 miles, at a highway-speed 2.5 mi/kWh closer to 125. Your own figure depends on the car, the speed, and the weather — EV efficiency in kWh per mile (coming soon) shows how to find and use yours.
Put your own numbers in
The formula is simple enough to do in your head: energy needed divided by the effective rate, with a mental “double the back half” for anything past 80% on DC. But the charging time calculator does the taper math precisely and lets you try scenarios in seconds — a colder day, a slower station, a 90% target instead of 80%. Enter your battery size, the lower of station-and-car kW, and your real SOC window, and you’ll get a number you can actually plan around.
Three things to carry away:
- The SOC window, not the battery size, drives the estimate. Enter the real start and end.
- Enter the binding kW — usually your car, not the station. A big station can’t beat a small onboard charger or a capped DC rate.
- Above 80% SOC, DC time stops being linear. That is the whole reason to stop at 80% and go.